Victory for Monitoring Toxic Incinerator Pollution!
 In Oregon, Senate Bill 488, a precedent-setting bill to continuously monitor toxic emissions from waste incineration, passed into law with the governor's signature on August 4, 2023. See the latest news coverage in Waste Dive (8/3/2023): Oregon becomes first state to require continuous emissions monitoring at incinerators.
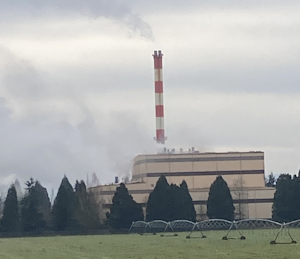
The law requires the state's only trash incinerator (Covanta Marion) to have to continuously monitor for dioxins/furans, PCBs, and toxic metals for 12 months. They'd be the first in the nation to have to use this modern technology, and it'll likely expose that actual toxic air emissions are far higher than what is shown by once-per-year self-administered "best behavior" tests. Continuous testing at incinerators in Europe has shown that dioxins, the most toxic chemicals known to science, are emitted at rates 32 to 1,290 times higher than we think they are in the U.S. when we test just once a year.
This will have national implications once that data comes out. It's the first time these toxic chemicals will be tested continuously in the U.S., and should put to rest the claims that the testing technology is not available.
This hard-won victory could not have happened without the work of our member groups, Beyond Toxics and the Clean Air Now Coalition. Energy Justice Network has been working with them since 2019 to close the Covanta Marion waste incinerator, burning trash, medical, and industrial wastes in the largely Latinx community of Brooks, just north of Salem.
Requiring continuous emissions monitoring is one of the key strategies we've been using to prevent air polluting industries with local ordinances and to hold existing ones accountable. It's one of the key points we raised in a 274-group strong October 2022 letter to the White House Council on Environmental Quality about EPA's bad policies relating to waste incineration.
If we regulated motorists the way we do most pollutants from smokestacks, it would be akin to enforcing a speed limit by allowing drivers to drive all year with no speedometer. Once a year, a speed trap would be set on the highway with signs warning "slow down... speed trap ahead," and the driver's brother would be running the speed trap (companies choose who they pay to conduct the test).
For nearly everything with a smokestack in the U.S., continuous monitoring is only used for three pollutants, and none of the toxic ones. As we change this reality and find that we're exposed to far more than we realize, it could be a game changer for getting these toxic industries closed for good.

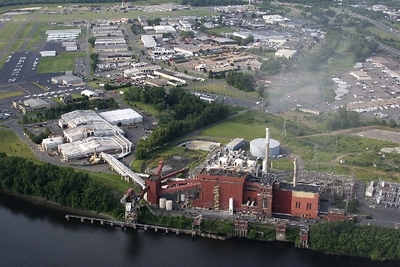 Hartford, Connecticut is home to an aging and very polluting trash incinerator that the state would like to close. This state-run incinerator serves 70 Connecticut towns and is the county's second largest air polluter. Shutting it down is a great idea, but...
 On January 10th, Tyler Corners LP