Trash incinerators (a.k.a. “waste to energy” facilities) in the United States are located in communities where people of color (especially Black residents) are disproportionately impacted. The largest and most polluting trash incinerators tend to be in communities of color, a major environmental justice issue. The trends show that race is more of a factor than class, as has been found in other studies of environmental racism.
September 2022 Update! We recently updated our analysis using the 2020 U.S. Census data, and will be updating the charts below. For now, the following (bolded) paragraph accurately describes the facts on the ground based on the 68 trash incinerators remaining after three more closed in 2022. The rest of the page is based on the 2010 Census data.
The trash incineration industry in the U.S., as a whole, does not have a disproportionate impact by economic class, but has a strong environmental racism trend. While 67% of the nation’s 68 remaining trash incinerators are located in majority white communities, the industry has a strong and disproportionate impact on people of color because the largest and dirtiest are located in majority BIPOC communities that tend to be more populated. Fifteen of the 20 largest trash incinerators (75%) are located in such communities. The environmental racism trend in this industry is found not by looking at how many incinerators are in communities of color, but when factoring in the number of impacted people living near them or the size of the incinerators. The 17 incinerators that are 2,000 tons per day (tpd) or greater have more capacity than the 51 incinerators that are under 2,000 tpd combined. On average, trash incinerators in majority BIPOC communities are surrounded by 2.5 times as many people and are twice as large as those in majority white communities: 27 facilities averaging 1,850 tons/day vs. 41 facilities averaging 909 tons/day.
Some studies exaggerate the environmental racism trend, using poor location data that misclassifies communities, and pretending that a community is a “community of color” if people of color are any more than 25% of the population. Few would consider a 74% white community to be a community of color, especially when the non-Hispanic white population in the United States averaged only about 60% in 2020.
The situation is serious enough that there is no need to exaggerate and make claims such as “the majority of trash incinerators are in communities of color” which is not true, nor is it true that a majority are in low-income communities or the combination.
Of the 71 commercial trash incinerators operating in the U.S. as of early 2021, 24 (34%) are in communities where people of color are a majority. Another 8 (11%) are in communities that are majority white, but still have more people of color than the national average (i.e. 50–64% white). All told, 66% of trash incinerators are in majority-white communities and 55% are in communities where the white population is above average. So, how is this environmental racism?
There are two reasons why people of color are more impacted by trash incinerators in the United States:
- the trash incinerators in communities of color are in far more urban locations, affecting many more people, and
- the largest (and most polluting) trash incinerators are the ones located in communities of color
16 of the 20 largest trash incinerators are in communities where the population of people of color is higher than the national average, and people of color are a majority of the population in 14 of these top 20. It’s therefore true to say that, of the 20 largest trash incinerators in the U.S., 70% are in communities of color and 80% are in communities where people of color are disproportionately impacted.
A good example is Connecticut. The state has five trash incinerators. Three of them are in majority white communities. However, each of the two that are in communities of color are larger than the other three incinerators combined, and are in urban areas affecting far more people.
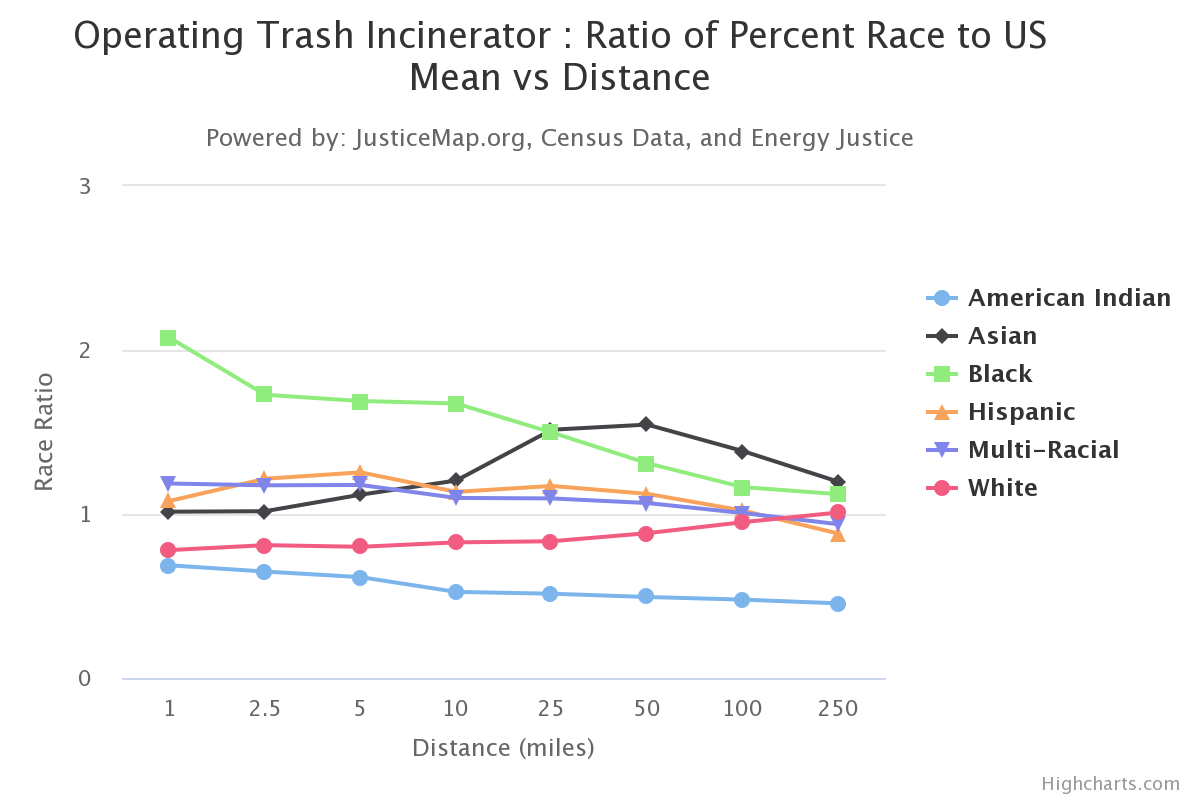
The two charts below are from our SpatialJusticeTest.org site, an environmental justice analyzer that can evaluate race and class disparities at a range of distances across many locations at once. If the trash incinerators in the analysis were equitably distributed, all racial and ethnic groupings would follow the ‘1’ line. Those above it are disproportionately impacted at the mile distance on the X axis. As you’ll see, Black people are the most disproportionately impacted and are disproportionately impacted all the way out to 250 miles. White people are less impacted than average until somewhere between 100 and 250 miles away, which means that people of color generally are more impacted than they would be if trash incinerators were equitably distributed. This analysis factors in population, but does not factor in the size of incinerators or their pollution levels, which magnify this disparity.
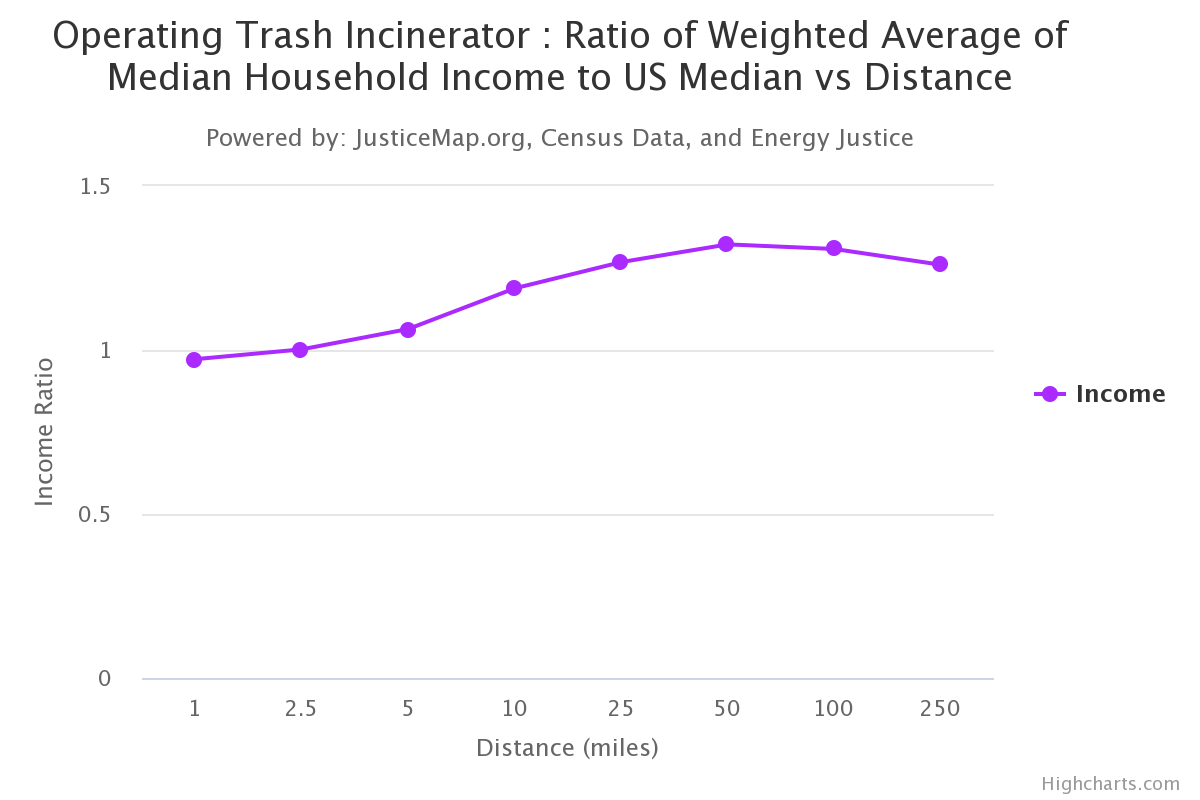
As the second chart shows, the racial disparity is not simply a result of incinerators being located in poor communities. 11 of 71 (15%) are located in low-income communities, and on average, trash incinerators are located in communities with household incomes that are very close to the national average. This affirms other research on environmental racism that shows that race is more of a factor than class on where many noxious industries are located.
This is based on 2010 U.S. Census data (for race/ethnicity) and a more recent 5‑year average of American Community Survey data (for household income) from our JusticeMap.org site and trash incinerators location data from our mapping project where we manually and precisely mapped every incinerator.
Click here for a more specific breakdown of the Spatial Justice Test charts above.
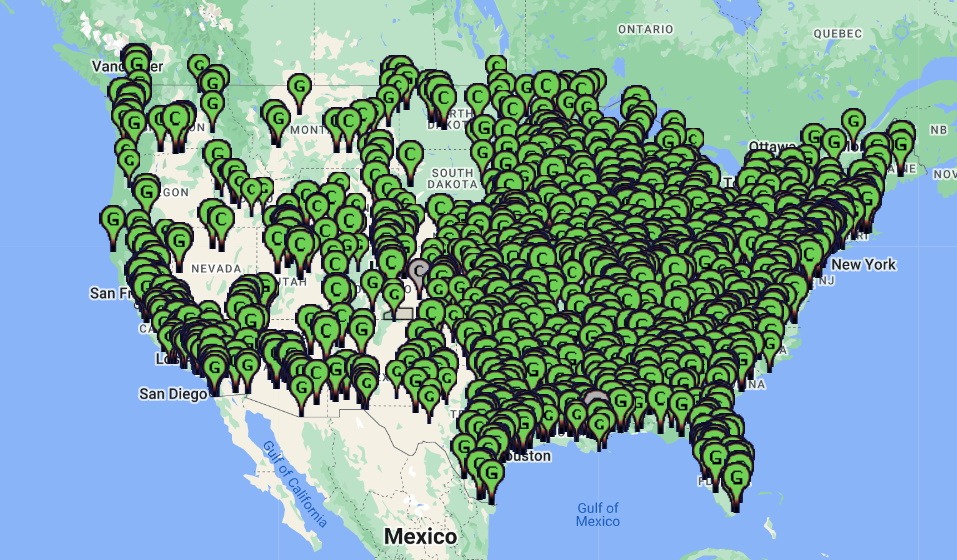
Click here for a map of trash incinerators in the U.S.
You can also click on the incinerator names below to find more detailed race and class breakdowns around each incinerator listed below.
Non-Hispanic white populations in red are communities of color, and those in orange are majority white, but still disproportionately impacting people of color (i.e. white population is 50–64%). [National average non-Hispanic white population in 2010 census was 63.7% and is estimated at just under 60% in 2020.]
Incomes in red are low-income.