
The variable operations and maintenance (O&M) costs are as follows:
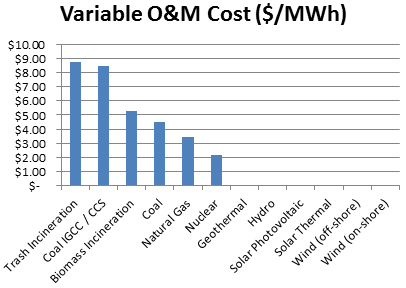
Variable O&M costs include fuel and other consumable materials and supplies; raw water; waste and wastewater disposal expenses; purchased power (incurred inversely to operating hours), demand charges and related utilities; chemicals, catalysts and gases; ammonia for selective catalytic reduction (SCR), as applicable; and lubricants.
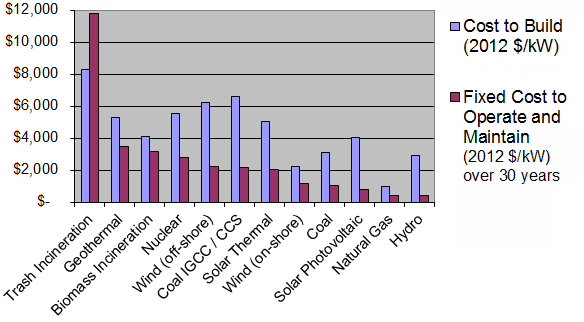
Source: “Updated Capital Cost Estimates for Utility Scale Electricity Generating Plants,” Energy Information Administration, April 2013, p.6, Table 1. Full report here: www.eia.gov/forecasts/capitalcost/pdf/updated_capcost.pdf
To summarize the EIA table in the charts above, we did the following:
- Biomass: used the bubbling fluidized bed type, since combined cycle requires gasification and biomass gasification is highly unusual (most are conventional boilers or fluidized bed)
- Coal: this is an average of single and dual advanced pulverized coal (the traditional sorts of coal plants that can no longer be built in the U.S.)
- Geothermal: took the average of the two types
- Hydroelectric: included only conventional and not pumped hydroelectric (neither of which tends to be proposed)
- Natural Gas: this is an average of conventional and advanced combined cycle (the typical plants built, since combustion turbines and fuel cells are not commonly proposed)
- Solar photovoltaic: this is an average of large and small