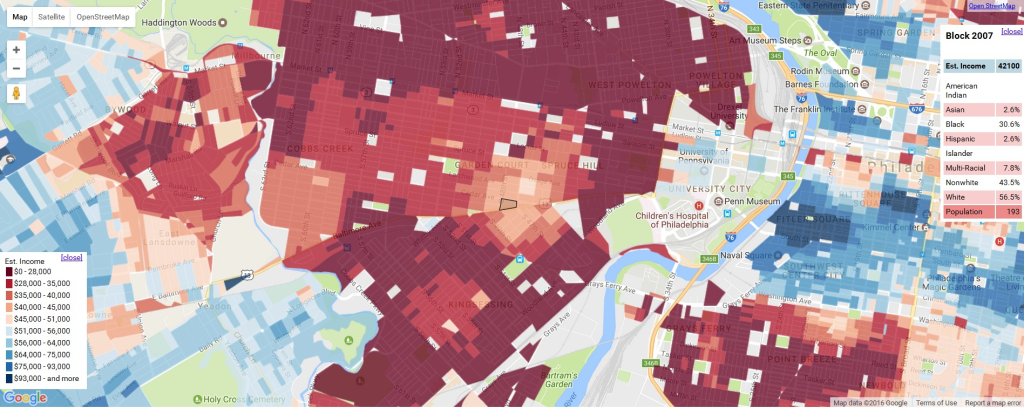
We wanted to create a visualization that shows how income varies by block to facilitate community environmental justice organizing. In some neighborhoods there are major differences between blocks, and these differences are used by corporations to decide what blocks to target with toxic facilities.
So we recently finished a highly experimental layer that estimates median household income by block. This could be used as an Environmental Justice Index. It is comparable to the EPA’s EJScreen’s EJ index. Both are estimates, but this block income index has a higher geographical resolution, and may also be more accurate (as the block group data that they use has very large confidence intervals). In the US there are 6 million populated blocks and 200,000 block groups.
The Census Bureau does an annual survey, the American Community Survey, which is less accurate than the decennial census as it only samples 1% of the population. So for income data the best resolution you can get is the census tract — or typically 4000 people. And for that resolution, due to the small sample, the 90% confidence interval is often very substantial — often plus or minus 20%. So most high resolution maps of median household income will use census tracts.
However, the Census collects race data from everyone and that is available at the census block resolution! Census blocks typically have 1 to 200 people.
So we created a visualization that combines the census tract income with the racial demographics of each block. We then apply a smoothing algorithm to it. So each block is influenced by the surrounding blocks.
The result is highly experimental. It should be seen as more of a visual tool than an estimation. It has error from the census tract income confidence interval, using the latest census block race data from 2010 (US population is up 5% since 2010), assumptions regarding the median household income by race, and the smoothing algorithm. However, I’m estimating that this is more accurate than other measures and that people will often want to visualize block by block differences.
How accurate does this look for your neighborhood?